Do you want to get better insights into how people interact on your website and apps?
As a marketer, one thing that we love the most is getting to know our target audience better. So, what can be better a source of understanding your audience than your website visitors and app users, right?
Using traditional analytics tools like Google Analytics, and Kissmetrics, you get to know about your website traffic with data like the number of users, page views, traffic sources, etc. But when it comes to optimizing your site to improve conversion rate, you want insights into how people interact with different elements on your site.
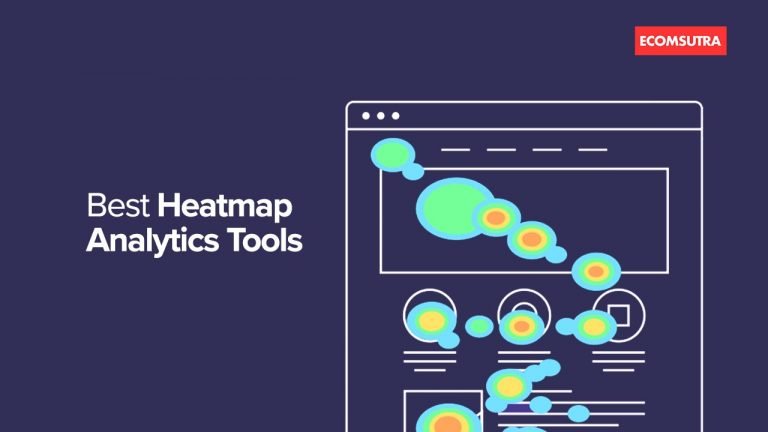
And that’s where Heatmap tools can help you see how visitors are engaging with your website and apps. These tools use graphical representation to display where users click, how far they scroll, and how they really behave on your platform.
Here are some of the best heatmap tools that you can use to track and analyze user behavior on your website.
1. Hotjar

Hotjar is the best heatmap analytics tool that I have used till now. It uses a color-coded scale to illustrate the behavior pattern of your website visitors to help you understand how users engage and interact with your website.
Having this accurate information in your hand, you can instantly make changes to your website and optimize it for better performance and conversions.
Apart from its multiple analytics reporting, what makes Hotjar unique among other tools in the list is its Surveys. It allows you to target questions to users using behavioral triggers and get deeper insights out of it. Even the Hubspot Academy has stated that the Hotjar surveys have positively helped them accelerate their signups by 10%.
Key Features –
- With the help of Hotjar’s heatmap feature, you can readily track how many clicks, taps, and scrolls have been made on your website.
- Hotjar’s recording feature allows you to capture all the actions made by your users on your website.
- Hotjar’s Funnels helps you to monitor where your users drop-off or leave your website so that you can optimize for better conversions.
- Forms will help you collect potential information from customers according to your website requirements and eliminate the manual method of collecting responses.
- The Incoming Feedback is one of the most outstanding features of
Hotjar with which your users can visually rate their experience of using your website. - Feedback polls help you understand the potential reasons behind your user actions and engagements on your website.
- Hotjar’s Recruit test users feature allows specific users to participate and give feedback on Hotjar’s platform.
Pros of Hotjar:
- The extensive use of heatmaps and recordings built in one single platform makes marketers visually understand users’ behavior rather than focusing on data and metrics.
- Using polls and surveys is a smart idea for getting real answers from your users, which directs you to modify the right part of your website.
Cons of Hotjar:
- Hotjar does not segregate customer profiles. You will have to work a little hard by viewing all the results obtained.
- The funnel feature is very simple and needs to be improved for ROI tracking when compared to Google analytics.
Pricing Plans – Hotjar offers three pricing plans – Personal, Business, and Agency.
- Personal Plan starts with Hotjar Basic, which is free forever, and Hotjar Plus, which is $39/month. Hotjar Plus is mainly used by low-traffic sites and growing businesses (startups).
- The business plan is suitable for businesses of all sizes. Depending upon the number of page views you need to track, you can choose and pay your bucks.
- Agency Plan is for Agencies and Consultants who work with their clients. In this plan, you can also invite your clients to visually view and manage their data on Hotjar.
2. CrazyEgg
Crazyegg is a popular heatmap tool available in the market serving more than 3,00,000 customers. Crazyegg helps accomplish all your goals like boosting page views, increasing your sales rate, optimizing your website performance, and the list goes on.
Crazyegg provides you the engagement analysis data. It is ideally designed for marketers and product teams who can visualize various user insights via user recordings, confetti heatmaps, A/B testing, and snapshots.
Confetti heatmaps is a unique feature of Crazyegg that helps you track where your users come from. It displays results based on traffic sources.
Key Features –
- You can get access to 5 different types of heatmaps to analyze your user’s experience on your website visually.
- You can record the entire user session and also can filter your audience by source. Crazyegg allows you to segment your audience based on factors like most active/old/new users.
- It allows you to test your specific interface using A/B Testing so that you can easily modify or update and implement effective conversion rate optimization strategies for your website.
Pros of Crazyegg:
- Setting up and creating snapshots is one of the added advantages of using Crazyegg.
- Crazyegg offers an excellent and clean user interface for driving valuable insights and also provides good customer service.
Cons of Crazyegg:
- The A/B Testing does not offer complex functionalities, and it provides a basic interface only.
- Options for downloading user recording videos are not available.
Pricing Plans – Crazyegg offers five major plans, namely Basic, Standard, Plus, Pro, and Custom. All plans are free for the first 30 days and are billed annually.
The Basic plan starts with $24/month, for which you can track 30,000 pageviews/month. The Plus plan is the most popular pricing plan, which starts at $99/month and allows you to track 150,000 pageviews/month.
3. Smartlook

Smartlook is another powerful heatmap analytics tool that enables you to analyze user behavior on both websites and mobile applications (IOS and Android).
You need not toggle between the numbers and the graphs, and Smartlook eases you by answering the ‘why’ behind your user actions on your website.
One of the most critical and influential features offered by Smartlook is event tracking. This feature allows you to create specific events on your website. You can include the event on your website and see it with your eyes about how visually your users engage with it.
Smartlook is ideal for small-to-medium businesses, CRO specialists, e-commerce sites, UX, and product marketers. It has been ranked within the top 100 software products in the 2019 G2 Crowd Awards.
Key Features –
- The automatic event tracking feature helps you find the specific interaction of your users on your website via replays.
- Event statistics feature lets you create a custom event (e.g., add to bookmarks) and analyze how many users have used and interacted with that option so that you can decide whether to use that option permanently or not on your website.
- It allows you to automatically fast forward a replay so that you can save your time by watching the critical sections of your visitor interactions.
- The funnels are connected to the recordings. As a result, you can watch where your visitors drop-off from your website which can be very useful for optimizing your call-to-action placement.
- All the data you create is rightly available on the Smartlook platform from the day you start.
- The retention table helps you find where your users find it hard to interact with.
Pros of Smartlook:
- Smartlook offers many diverse features that help you to dive deep into understanding your customer behavior analytics.
- Event tracking is one of the best features offered by Smartlook that can help you upgrade the user experience to the next level.
Cons of Smartlook:
- Initially, the usage of funnels was a bit difficult to understand.
- The free version offers very limited features to use, but it premium plans are worth paying for.
Pricing Plans – Smartlook offers four beneficial pricing plans: Free, Starter, Power, Power Mobile. Smartlook offers additional discounts for annual payments.
- The Free plan is for personal and business use and readily suits bloggers and low-performing websites.
- The Starter plan starts at $39 monthly and is suitable for smaller businesses whose primary focus is to enhance user experience.
- For larger companies with multiple projects, the Power plan would be highly affordable, starting at $99 monthly.
To gain valuable insights for mobile applications, you can opt for the Power mobile plan starting at $135 monthly. It supports both Android and iOS applications.
4. Mouseflow
Mouseflow is one of the best behavior analytics tools that helps you in optimizing your website via heatmaps, user recordings, conversion funnels, form analytics, and feedback campaigns.
One of the unique features of Mouseflow is that it provides your website a ‘friction score’. A friction score is a number that indicates the level of your user’s frustration on each page of your website.
With a friction score, you can immediately fix and solve your website issues, problems, and improve the usability experience.
Mouseflow is highly helpful for startups, small businesses, digital marketers, and enterprises to accelerate their website conversions and user experience.
Key Features –
- Mouseflow provides session replays for each user on your website, and you can filter/segment them.
- It allows you to build six types of heatmaps for all your pages automatically and collect instant data.
- You can instantly set up Funnels, which helps you visually gather insights into where your users drop off.
- The usage of forms will help you to uncover potential website issues, improve lead-generation and usability issues.
- You can set up feedback campaigns on your website to understand the user problems that you can use to enhancing user experience.
Pros of Mouseflow:
- Mouseflow offers a heatmap suite which is very useful for quick and fast analysis of your users’ interaction.
- A friction score is one of the unique features offered by Mouseflow to identify your website’s bugs and issues.
- Filtering/segment options are highly useful as it allows you to create a customized profile list for your better analysis.
Cons of Mouseflow:
- You cannot add notes to recordings, making it difficult for your team members to analyze the results.
- Mouseflow’s navigation initially would be a little tricky, but you can understand it as you gradually start using it.
Pricing plans – Mouseflow has a Free plan that permits you to use 500 recordings/month limited to one website. The starter plan starts at $29 ($24 annually) and allows you to capture 5000 recordings/month. Price increases gradually with added websites and increased recordings.
5. LuckyOrange

LuckyOrange is another powerful heatmap analytics tool that offers power-packed features to analyze your website performance and user experience.
One of the exciting features of LuckyOrange is the use of LiveChat features. You can integrate live chats into your website, and it works amazingly across multiple devices. You can give quick responses and offer excellent service for your website visitors.
LuckyOrange is ideally suitable for SMB’s, enterprises, and fortune 500 businesses.
Key Features –
- LuckyOrange displays unique colorful heatmaps that show how your users actively engage with your website. You can segment heatmap data by location, browser, dates, mobile users, and more.
- You can easily record and filter all the interactions which your users perform on your site and it records even the most advanced sites and single-page apps.
- You can get instant surveys and feedback from your visitors and dive into deep your website analytics using forms and polls.
- You can easily identify in which sections of the website your users get abandoned so that you can work on increasing your ROI using conversion funnels.
- LuckyOrange’s real-time dashboard lets you visualize unique insights that give you a clear understanding and better focus on user behavior.
Pros of LuckOrange:
- Its advanced recording features and integration with
live chat software that acts as customer support. - It provides real-time user tracking and better heat mapping features.
Cons of LuckyOrange:
- LuckyOrange doesn’t let you auto-delete recordings that don’t match a specific behaviour.
- The pricing plan has limits on the number of page views, and it automatically upgrades to the next higher plan that can increase your monthly expense.
Pricing Plans – LuckyOrange offers five pricing plans for your business: They are Starter, Small Business, Medium, Large, and Enterprise. The Starter plan starts at $10/month and allows for 25,000 monthly pageviews limited to 1 website. Custom plans are also available.
Wrapping Up
Heatmap tools are one of the most valuable analytics tools that let you track your website user behavior and analyze it to improve its performance. It ideally serves all your business needs and helps you in boosting your website conversion rate.
Enriching the user experience is the key element for higher ROI for any online business. And when you have such powerful analytics data like heatmaps, you need not struggle in guessing what to work on next.
So, start using heatmap tools and make calculated decisions to optimize your website and grow your business. You should also check out my guide on website heatmaps to understand what it is with some practical use cases.
